Hello traders, today i will like to talk about Donchian Channel Strategy. Explain the result found during backtesting its data with ngpl.
The Donchian Channel is a tool used in financial markets to show the highest and lowest prices of an asset over a certain period of time. It's typically displayed on charts that use candlesticks to represent price movements. Candlesticks show the opening, highest, lowest, and closing prices of a stock within a specific time frame. So, the Donchian Channel essentially draws lines connecting the highest and lowest points of these candlesticks over a set period.
Strategy parameter
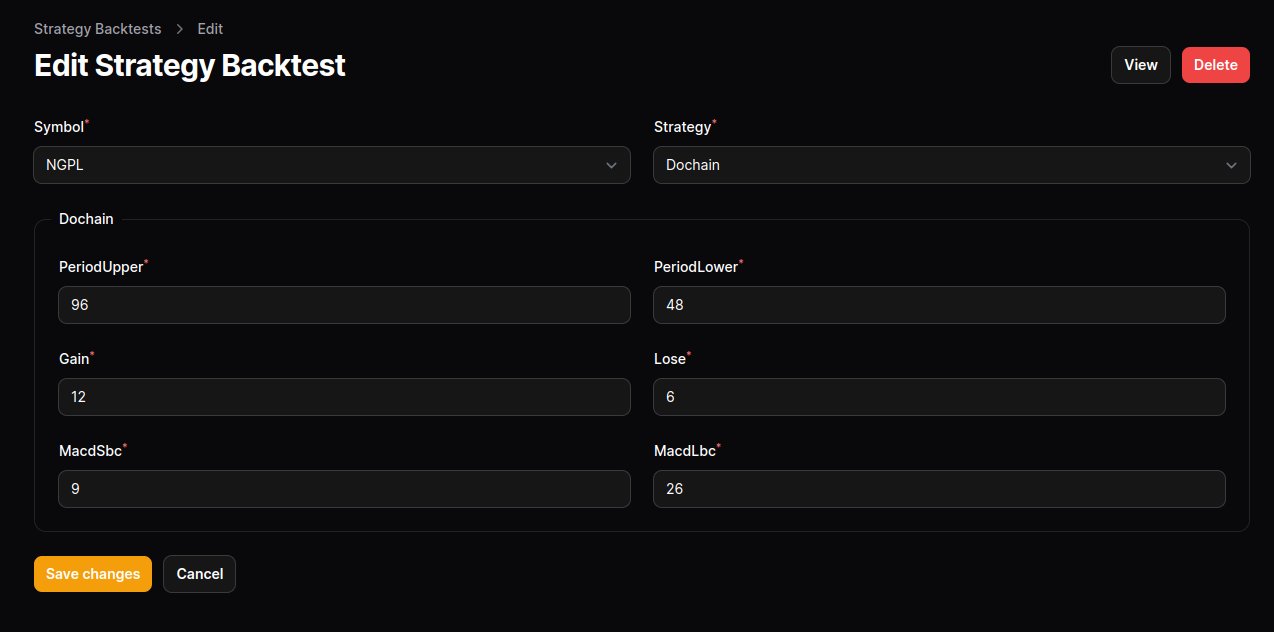
Upper Channel = 96 days
Lower channel = 48
Macd short bar = 9
Macd long bar = 26
Stop gain : 12 %
Stop loss : 6%

Setup
Buy Signal Generation: The strategy generates a buy signal when two conditions are met simultaneously:
The price breaks above the upper Donchian Channel band (indicating potential upward momentum).
The MACD (Moving Average Convergence Divergence) indicator crosses above zero (indicating potential bullish momentum).
Sell Signal Generation: The strategy generates a sell signal when any of the following conditions are met:
The price falls below the lower Donchian Channel band (indicating potential downward momentum).
The price hits a stop gain or stop loss threshold.
Additionally, it checks if the trade falls within a specified time range.
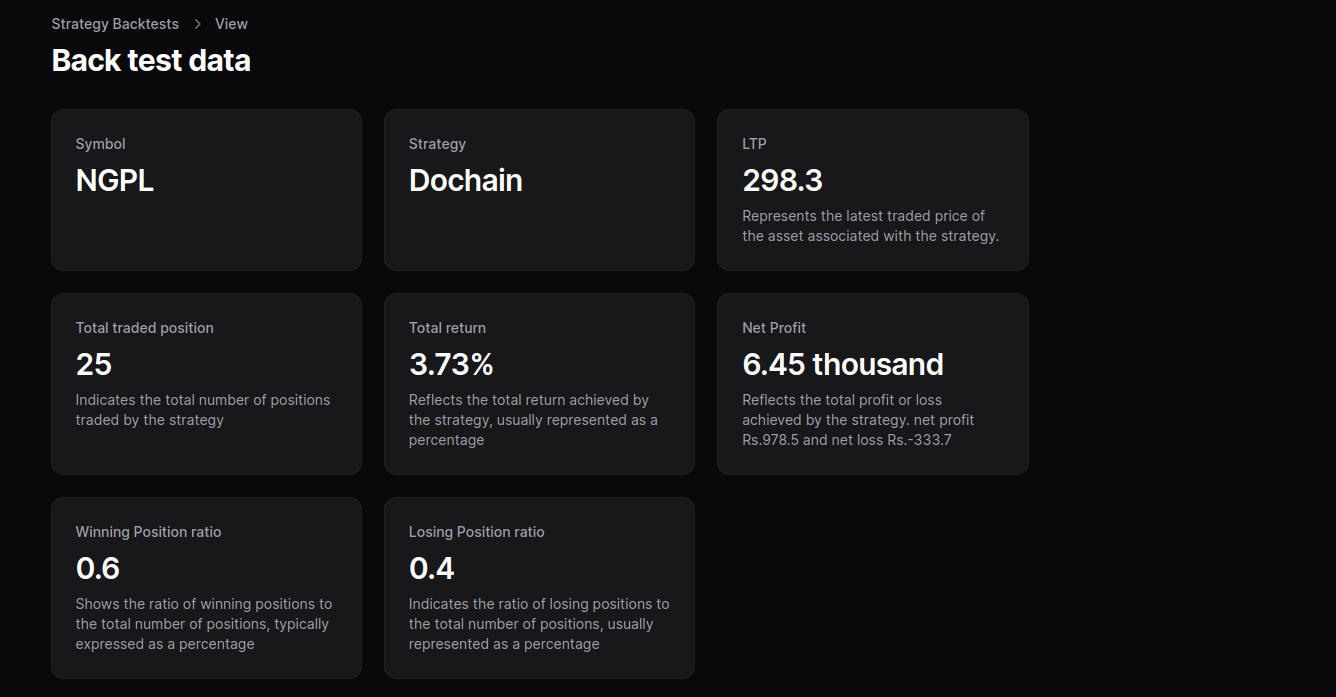
When I run the back test with other stock it was showing ok return, When I run it with ngpl. we can see that winning ratio:losing ratio is 0.6:0.4.

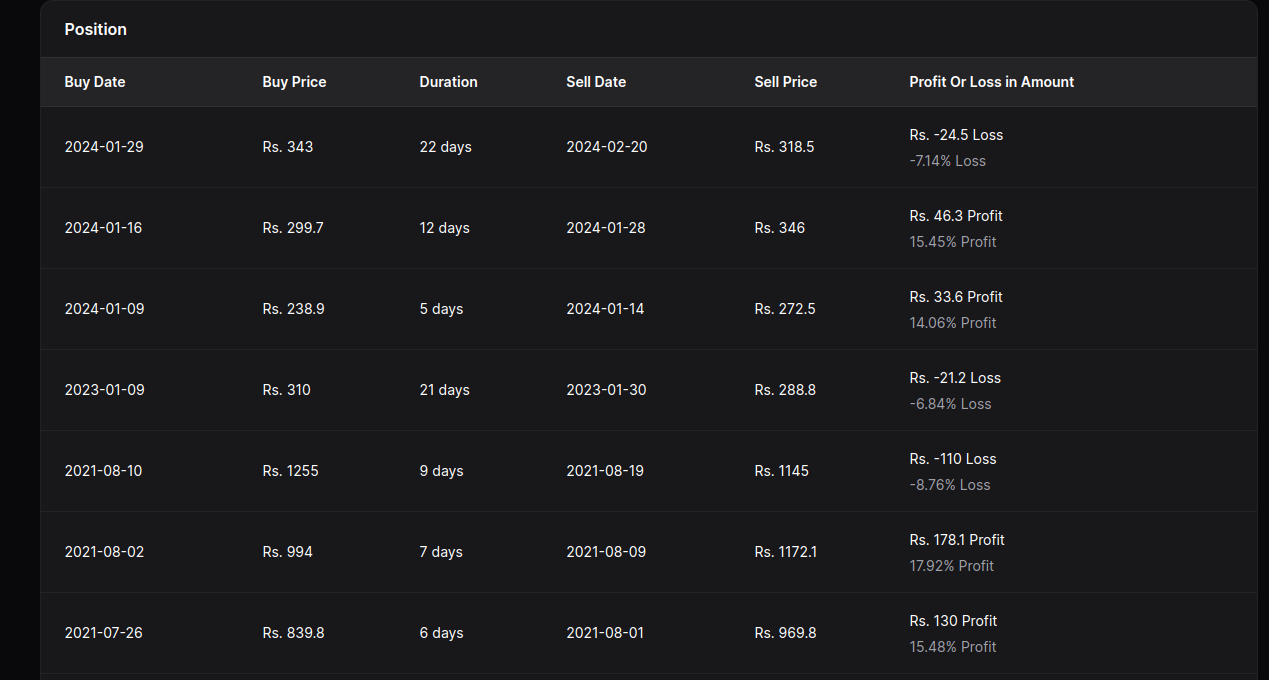
When I study the list of position of last 7 trades. It give average 3.5% profit. Taking all trade in account, we can see that it has give you 2.73% as return.

I have also backtested other script but is not able to get better result than this.
You can also test your stock here https://trader.avocado.com.np/admin/strategy-backtests