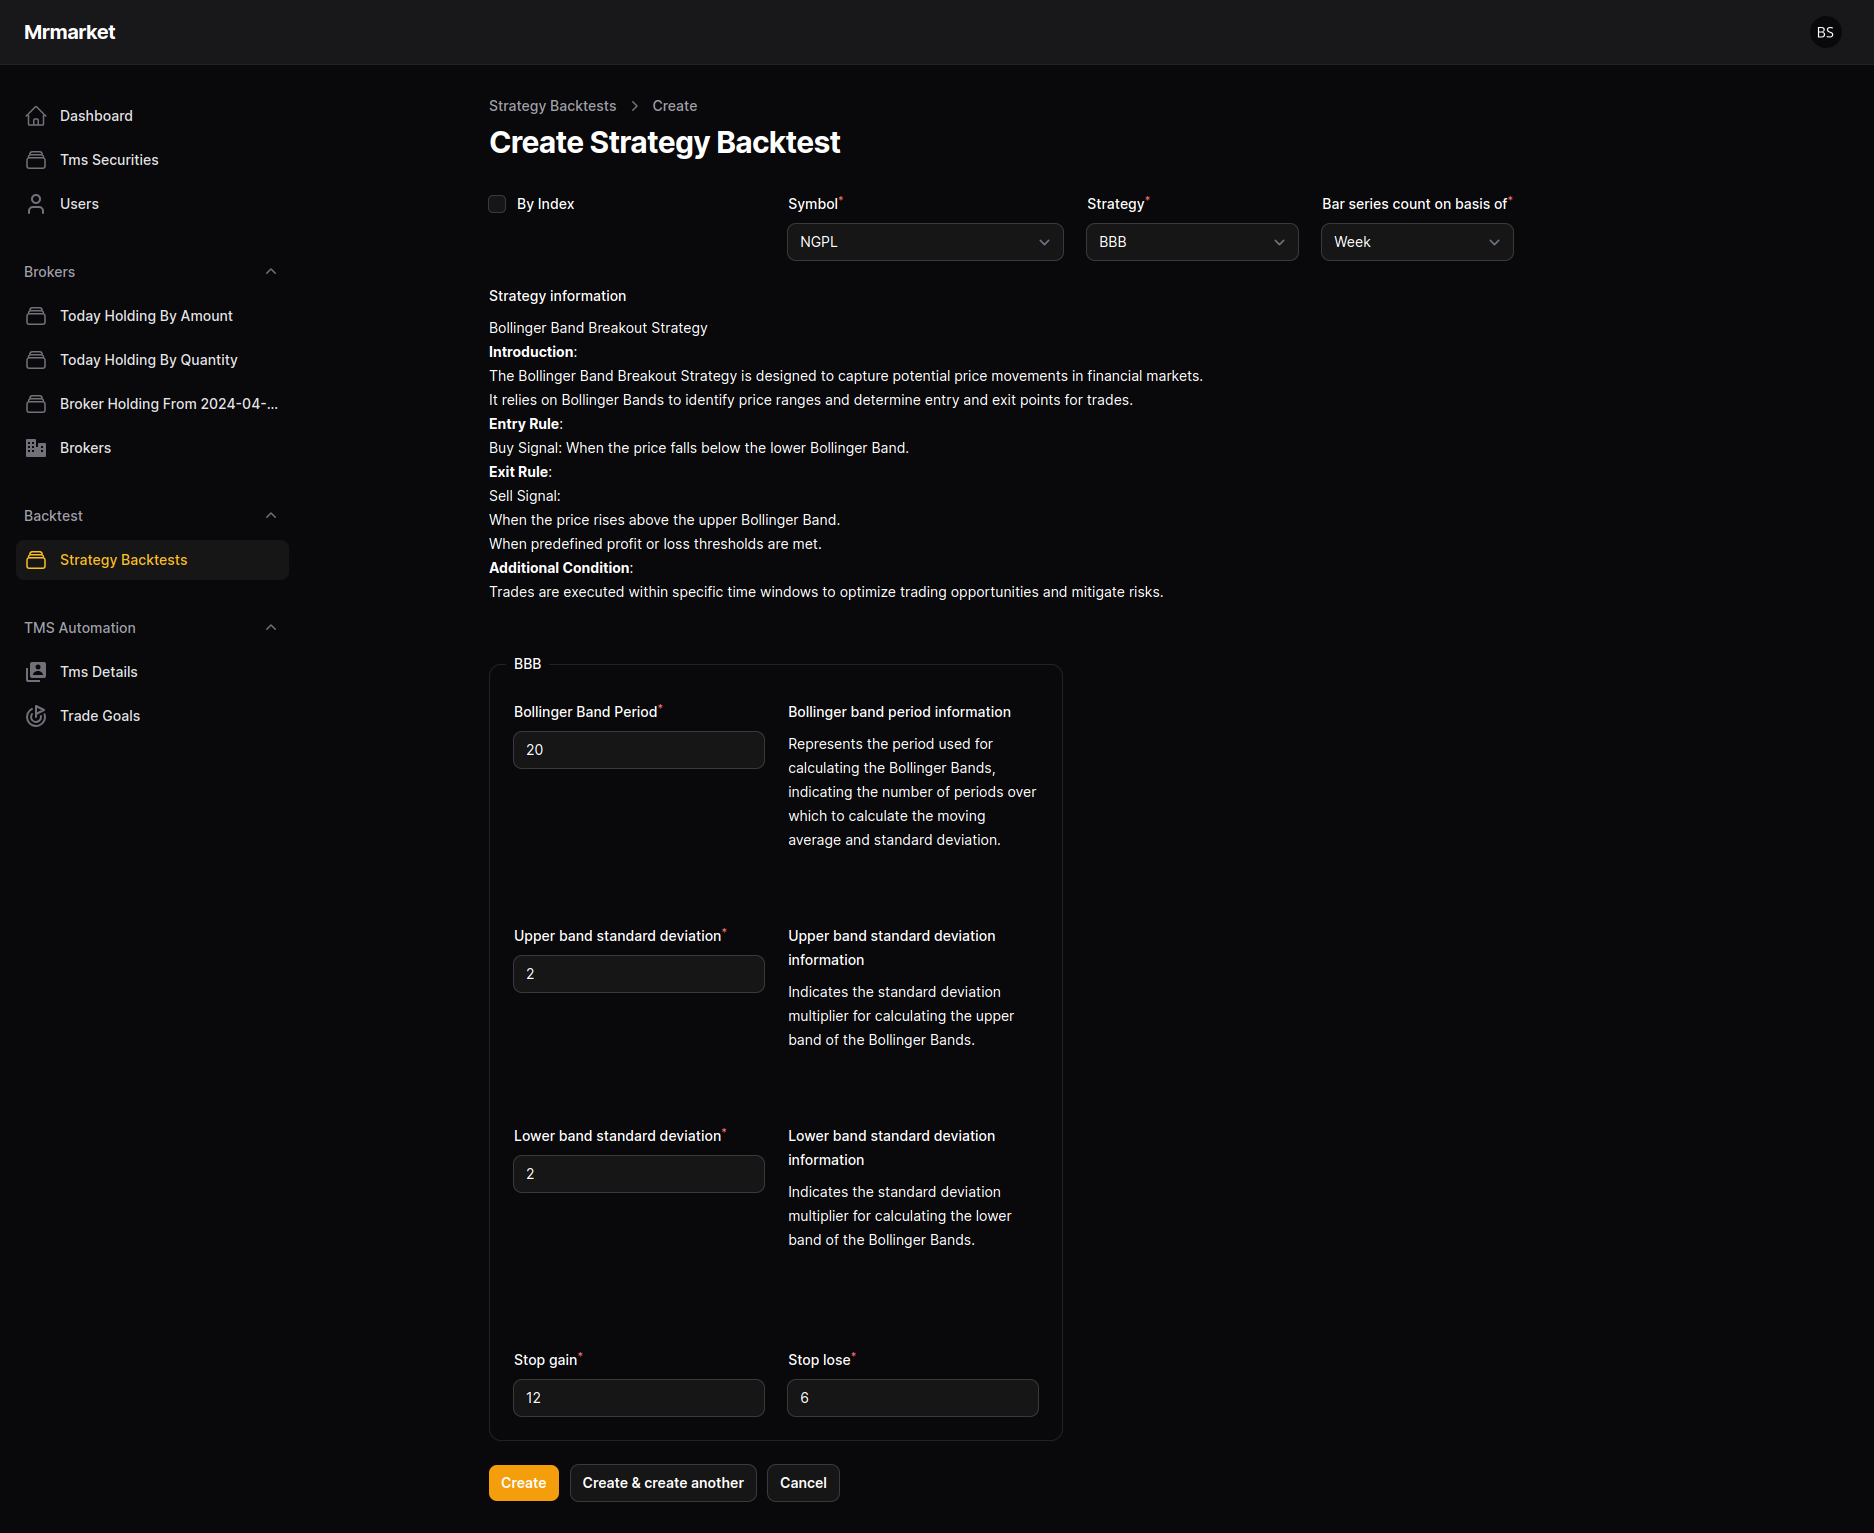
In our Mr market nepse platform, We have added a new feature called strategy backtest. We have compiled a dozen of backtest this week and our loyal users have been using it ins and out. We have also noticed that each strategy given on the strategy drop down is vague in itself. So, I will try to explain those strategies one by one via this discussion post.
What is bollinger band breakout strategy?
The Bollinger Band Breakout strategy initiates trade upon price breaches of either the upper or lower bands, indicating a potential extension of the existing trend. Traders may opt for long positions upon price surpassing the upper band, while short positions can be established when it falls below the lower band. To mitigate risk, traders can implement stop-loss orders positioned slightly beyond the breakout point.
In our platform, we are creating the strategy by below details
Bollinger Band Breakout Strategy
Introduction:
The Bollinger Band Breakout Strategy is designed to capture potential price movements in financial markets.
It relies on Bollinger Bands to identify price ranges and determine entry and exit points for trades.
Entry Rule:
Buy Signal: When the price falls below the lower Bollinger Band.
Exit Rule:
Sell Signal:
When the price rises above the upper Bollinger Band.
When predefined profit or loss thresholds are met.
Additional Condition:
Trades are executed within specific time windows to optimize trading opportunities and mitigate risks.
We will ask a couple of parameters for this strategy, if you don’t know what this parameter does and how to tune it, leave it untouched for now. But if you are a technical analyst who can conceptualize the chart, you can tune these parameters.
Parameters
Bollinger band period information
Represents the period used for calculating the Bollinger Bands indicating the number of periods over which to calculate the moving average and standard deviation.
Upper band standard deviation information
Indicates the standard deviation multiplier for calculating the upper band of the Bollinger Bands.
Lower band standard deviation information
Indicates the standard deviation multiplier for calculating the lower band of the Bollinger Bands.

When you submit the form, it will redirect you to the trading records, its output related to trading such as return, winning or losing ratio, max draw down, risk to reward ration base on max drawdown and excetra.
We all know that Nepal is still in the growing economy market unlike our neighbor country India. However, India have reached so far on the topic of systematic trading. I think one of the key requirement to achieve systematic trading will be buy and sell with less human interventions. Yes, read it again. So using the industry standard and knowing trading indicator, we can have huge competitive advantage to pick stock. I believe true meaning of the market is it is zero sum game, meaning the money you lost is someone else gaining. Money you have booked as profit while someone will be losing. So capital in capital market will always be there, only trader/investor will be different. If you are able to master the discipline of trading, Market will reward us good i guess 🫥