Supertrend strategy produce buy signal today on the nepse index. SuperTrend, a tool utilized in technical analysis, aids traders in recognizing market trends across various assets like stocks, currencies, and commodities. It generates a line on a price chart, delineating support or resistance levels. Traders analyze the position and directional shifts of this line to interpret market conditions. The color of the line signifies the trend direction: green signifies an uptrend, while red indicates a downtrend.
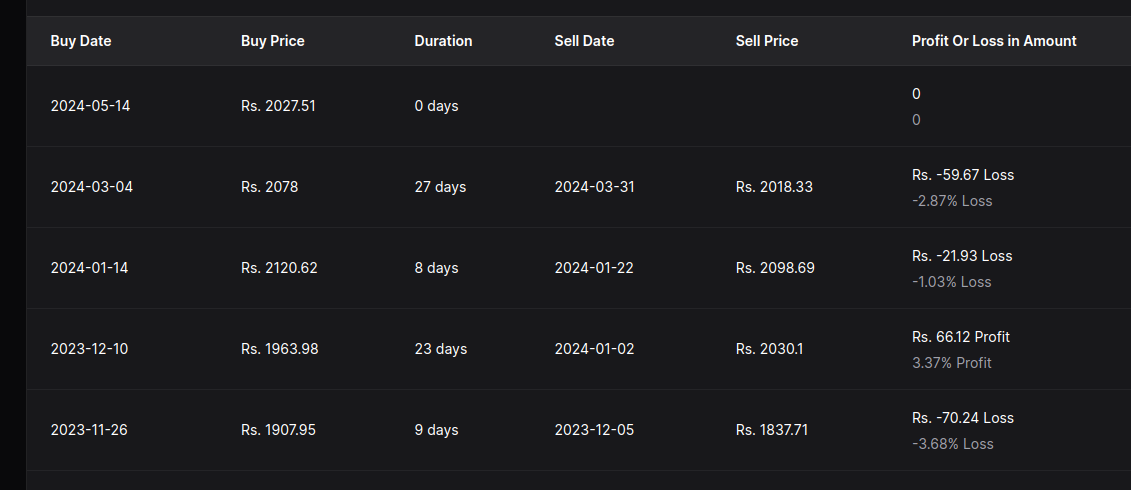
I have been keeping eye on this indicator for over 6 month. Whenever it signal buy on Nepse, there will be small bull run and then it will end soon. I have created backtest for nepse index using supertrend strategy on daily timeframe.
So taking 7 month older trade position as an example

- In 26th November 2023, it gave buy signal at 1907.95, 9 days past trade close at 1837.71 losing 70.24 points.
- five days Later, In 10th december 2023, it produce buy signal but this time close with profit of 66.12
In recent trade, it seem to be losing the trade, so there is a big question mark on what it is meant now. Will market will rise or it will fall yet to find out.