Hello Traders,
It has been a rough couple of months in my trading journey. Before Dashain and Tihar, I took some big losses from my trading setup. Every time I failed, I would go back to coding and reflect on what went wrong. From my point of view, our platform has been running for nearly a year now, and during that time, I have introduced a lot of features. Among these, Strategy Backtest has always been my dream trading tool. My vision for developing this feature was to enable systematic trading with minimal human intervention.
One of my main issues is that I tend to be a reckless trader; I’ve been buying high and selling low for most of my trading journey. Acceptance is key, right? Strategy backtesting allows us to test a trading setup by using a single technical indicator and setting clear buy and sell rules for trades.
Today, I’d like to discuss my current trading setup, the BBreakout strategy, which stands for Bollinger Band Breakout strategy.
What is the Bollinger Band Breakout Strategy?
The Bollinger Band Breakout strategy helps traders decide when to buy or sell based on price movements within set boundaries, known as Bollinger Bands. These bands have three main lines:
- Middle Line: The average price.
- Upper and Lower Lines: The typical high and low price range.
A breakout occurs when the price moves outside these bands:
Buy Rule:
- Condition: When the asset's price drops below the lower Bollinger Band.
- Rationale: A price dip below the lower band suggests the asset may be “oversold” or undervalued, increasing the likelihood it will rebound.
- Action: This creates a potential buying opportunity, as traders expect the price to move back toward or above the average.
Sell Rule:
- Condition 1: When the asset’s price rises above the upper Bollinger Band.
- Rationale: A breakout above the upper band may indicate the asset is “overbought” or overvalued, suggesting it could soon pull back.
- Action: Traders might sell here to capture profits, as the price is likely to fall back toward the average.
- Condition 2: If the price reaches a set profit target or stop-loss threshold.
- Rationale: This helps lock in gains or limit losses, keeping trades within acceptable risk levels.
- Action: Selling when a specific profit or loss target is met ensures a disciplined approach, reducing the chance of significant losses.
Currently, I am using simple automated trading on RFPL stock. Please use the automatic trading feature carefully. At the moment, we have options for selecting the TMS account and quantity. Essentially, the setup will place an order for the specified quantity (e.g., 50 shares) whenever it generates a buy or sell signal.
Additional Trade Goal Hack
One extra feature I added is that it creates a trade goal based on the “buy low and sell high” principle, rather than executing at the exact buy/sell price when a signal is generated.
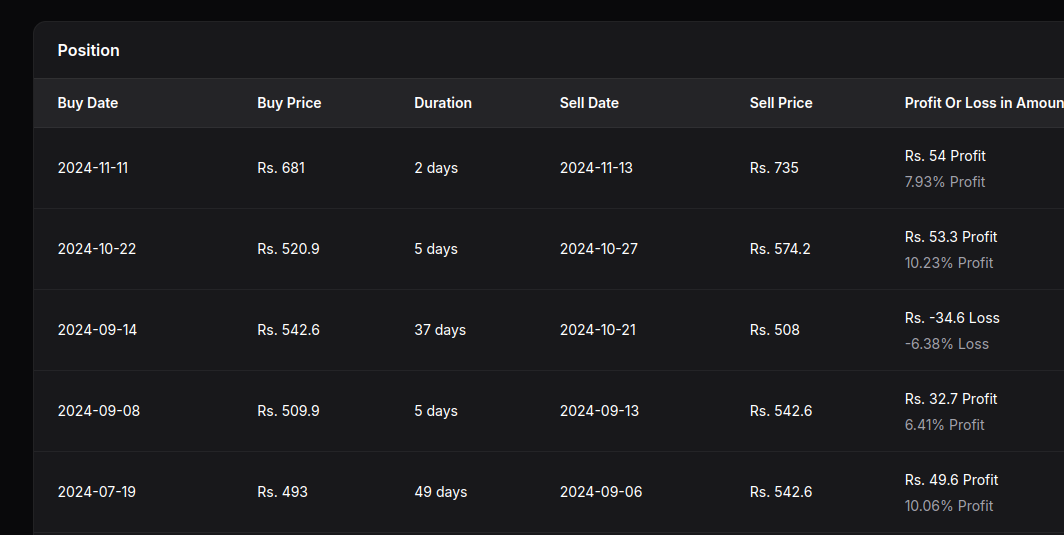
Let me break it down in simpler terms. The image below shows a list of positions being generated for buy and sell signals:

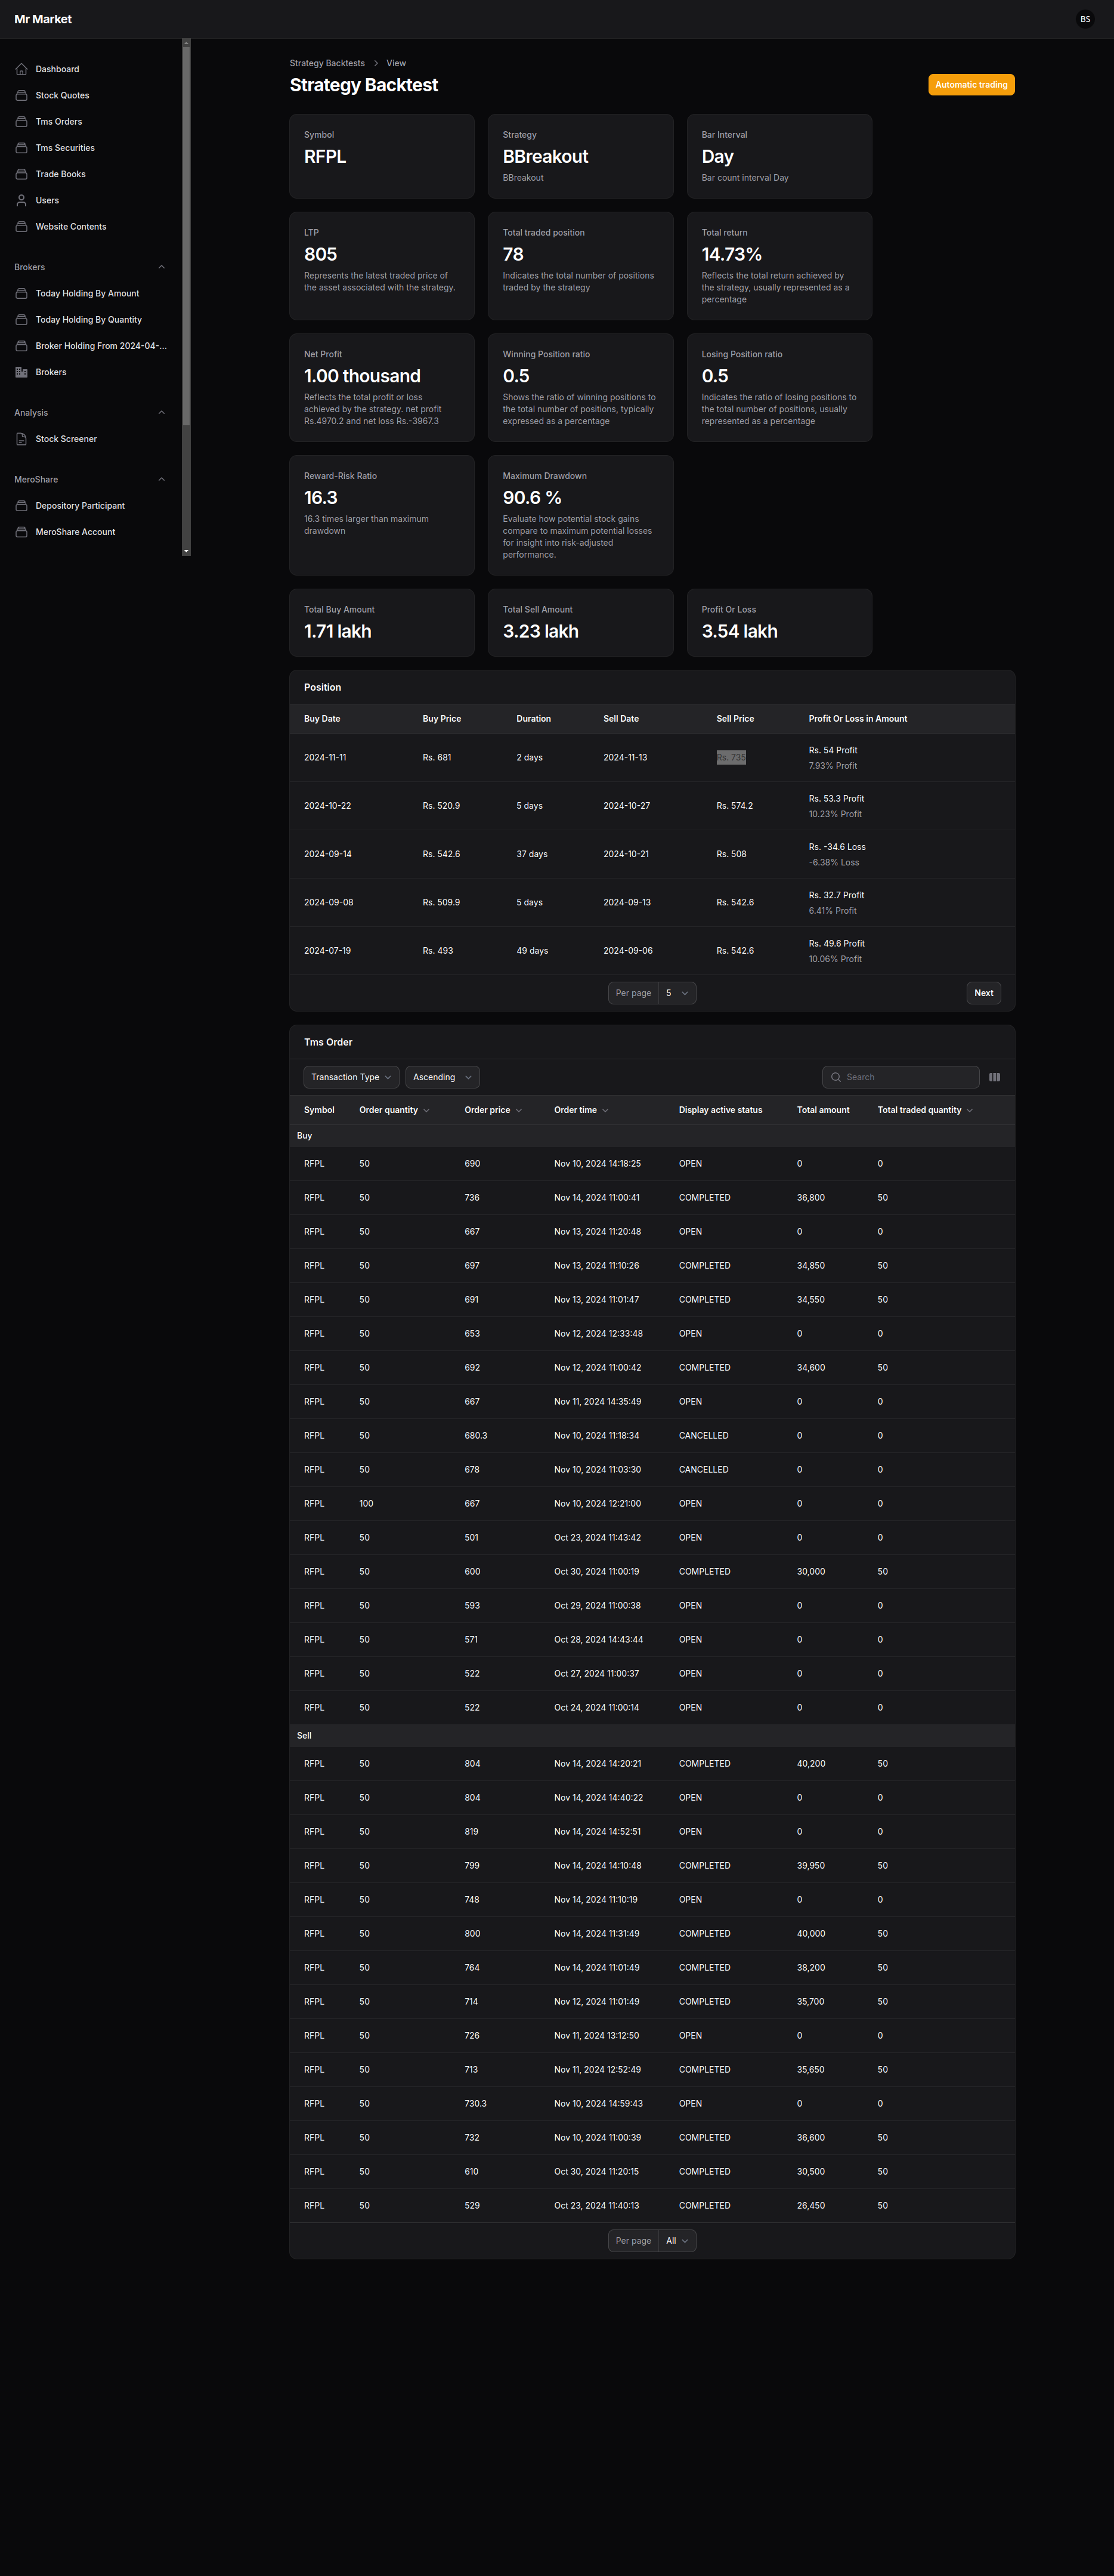
I have been following this stock for over four months. Initially, I faced losses on this stock, but over the past two to three weeks, it has generated a good ratio of buy and sell signals. Recently, it generated a sell signal at Rs. 735. The setup has been selling 50 shares daily across multiple trade goals. During buy signals, we accumulated shares at a favorable price due to the “buy low” strategy. It requires patience, as I avoid intervening.
Below is my TMS Order list. Note that this feature was recently added, so it only has one to two weeks of trade details:
